Optimizing Device Financing Sheds Cost, Drives Revenue
A data-driven optimization process expands opportunity, improves profitability, and reduces risk for communications service providers that offer device financing


Mobile operators have succeeded tremendously with device financing since introducing it in the early 2010s. As their offerings have become more complex, risk management processes relating to financing have been tested. With more devices and types in play, operators are forced to make more decisions about the creditworthiness of each customer, not just on a transactional basis, but account-wide and long-term. Understanding how credit approvals should be governed has become much more complex as a result. If controls are too loose, the risk of loss increases quickly, while controls that are too tight result in opportunities lost to competitors.
Because many older risk management processes have now outlived their usefulness in this more complex environment, a new automated and data-driven device financing optimization process is needed. Optimizing device financing may be one of the few instances in which a mobile operator can still harvest low-hanging fruit in terms of both reduced risks and improved revenues, yet optimization is often overlooked despite its measurable upside.
Growth in Device Financing
Mobile operators rolled out device financing around 2013, when T-Mobile US introduced it in the US. By 2022, 80% of new mobile handsets in the US were purchased via financing agreement, according to GSMA.
Operators have continued to finance a wider variety of devices for customers ranging from smartphones, tablets and hotspots to dongles, watches, earbuds, car mounts and charging accessories. In 2024, the top three US mobile operators generated more than 6% of their wireless revenues from device financing — roughly $17 billion on $267 billion in wireless revenues, according to data collected from Statista and Globe Newswire.
Device financing opportunities will continue to expand into new arenas as well. Mobile operators have begun to finance wearables, smart home and IoT devices, gaming consoles and accessories like VR headsets, and even home-based charging stations for electric vehicles. Globally, connected IoT devices alone are expected to reach nearly 19 billion units in 2024, adding 2 billion to 2023’s total.
For many operators, the popularity and growth of mobile device financing has required them to operate finance organizations large enough to serve millions of individual consumers and businesses. Many operators have continued to upscale and diversify their device financing operations just to keep up with expanding demands across their consumer, B2B, B2B2x, and IoT businesses.
As many more types of devices are financed, it becomes more difficult for the operator’s finance organization to assess the total risk acceptable per customer, scenario and account; to sustain the balance between marketing needs and acceptable risks; and to sustain a strong customer experience by matching what is offered to the customer with will be approved if ordered.
Device Financing Brings Risks
Device financing brings well-understood risks with it, but these become more complicated to assess and make credit decisions around as the financing landscape becomes more crowded and customers finance more devices per account.
The major device financing risks a mobile operator will face more often include:
Credit risks: At baseline, operators must assess whether customers can and will pay across a broader array of devices and device combinations per user and account.
Regulatory compliance risks: Operators need to assess for every transaction and account whether requirements are met for everything from personal data to taxes.
Depreciation and obsolescence risks: CSPs need to manage the lifecycles of a widening array of aging devices and recover costs while managing related risks like recycling and disposal.
Cash flow risks: Every mobile operator must play the delicate game of balancing its cash outlays for devices against potential customer defaults and ensure they are not negative at any point in a multi-year timeline.
Operational risks: Doing risk management wrong will be expensive in every way, from the cost of the IT tooling itself to the many costs of badly managed risks, missed opportunities, and poor customer experience.
Addressing Competitive Risks in Device Financing
Mobile operators face competitive risks too. Their competitors include the direct-to-consumer retail arms of their own device suppliers, which also offer aggressive financing and trade-in promotions to win device sales via financing.
The key for mobile operators is not simply to win more volume than these competitors. Rather, the winner will be the financing provider that can best evaluate financing risks from the portfolio level down, and balance them precisely against opportunity costs to capture and keep the highest value customers.
Implementation of this type of rigorous but flexible risk analysis can be achieved through an automated and data-driven approach to financing optimization. Getting optimization right will reduce costs in the sales and financing process, maximize revenue opportunities, and fulfill customer expectations better as the promotions, incentives, and offers extended can be honored.
Understanding Optimization for Device Financing
Optimization is the mathematical practice of identifying he set of decisions that best meets organizational goals. Optimization for device financing enables a mobile operator to make the hard trade-offs when balancing marketing and incentives against what the competition is doing. Business users can explore optimized strategies with simulation tools to better understand performance drivers and trade-offs. The output of deployed strategies is an origination decision for the customer and alternate optimal offers – pre-stored or generated in real-time. It enables operators to determine exactly what level of risk is acceptable as market scenarios change.
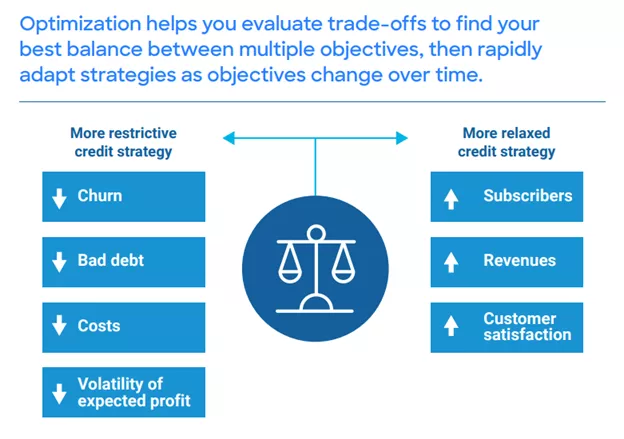
Any finance organization is responsible for deciding how to respond to changing market conditions, primarily by choosing whether to ease or tighten risk controls, or to change pricing or incentives. This is done continuously to beat competitors’ offers sometimes, most of the time, or all the time.
To provide a sufficiently thorough risk analysis, however, requires a variety of data sources that enable more granular risk profiles to be generated for a broader range of customer types. With more granularity, more accurate credit risk evaluations can be made that factor in more variables that build the case for the specific customer’s creditworthiness in the current scenario, and potentially in future scenarios.
Data analysis and decisioning
An automated and data-driven optimization process should provide this detailed level of data analysis to inform or automate crucial decisions an operator must make, such as:
- How much to ease or tighten risk controls to drive sales or reduce risk exposure
- How to change pricing or incentives to beat competitors
- How to maximize device sales on a market share basis
- How to adjust risk assessments for segments like IoT or digital-only consumer mobile, where evaluation methods and risk thresholds may differ
Facilitate change
Optimization should also give an operator the ability to facilitate rapid change and improvements in its risk management processes. Operators need to manage the complex logic behind risk evaluations and decisioning. Critically, they will need to zero-in on areas that can be improved, run forward-looking rather than reactive promotions, and free themselves from waiting on monthslong lag times to adjust offers and risk controls.
Simulate costs and outcomes
Ultimately the “killer app” in optimization is simulation. With this capability, operators can visualize outcomes based on various potential market conditions to evaluate different levels of risk and incentives in different market scenarios. Operators can then establish the worst-, base-, and best-case scenarios for each set of market conditions and predict how revenue, cost, risk and opportunity flows will change given adjustments in risk tolerances relating to finance approvals. This streamlines the process of evaluating new strategies and produces better results.
Don’t Sleep on Optimization
Optimization is the ideal approach to identify the right set of prices/rates that ideally balances portfolio size, credit losses, and customer satisfaction. The cost of overlooking optimization, particularly as device financing continues to expand, is that revenue opportunities will be missed, unnecessary risks will be accepted, and customer experiences will decline due to mismatches between what is offered and what can be honored.
For a large-scale device financing operation, optimization is the most practical way to cut costs and increase revenues. It balances decision-making in device marketing, sales, and financing against real, measurable customer and business risks. And it leverages automation and intelligence to overcome scale and complexity, to deliver actionable plans for responding to market changes, and to create device financing offers across every market that beat the competition and balance those wins against financing risks.
How FICO Helps Telcos Optimize Financing
FICO Pricing Optimization harnesses the power of prescriptive analytics to create more profitable pricing strategies across the customer journey by putting the right offer into the right hands, at exactly the right time.
With optimization, you can set more granular price strategies that strike the right balance between margin and volume while considering key data points like competitor rates, macro-economic factors, internal goals, and compliance requirements, resulting in finding the best possible solutions within multiple possible outcomes.
Learn more:
- Read case studies that show how FICO customers have benefited from optimization.
- Understand how FICO helps telcos build stronger, safer and more profitable customer relationships.
- Find out about FICO’s originations solutions
- Read my post Re-inventing Device Financing for Telcos
Popular Posts

Average U.S. FICO® Score at 716, Indicating Improvement in Consumer Credit Behaviors Despite Pandemic
The FICO Score is a broad-based, independent standard measure of credit risk
Read more
The GSE Data Is Public. Here's What It Shows About Credit Score Modernization.
Independent Milliman analysis of GSE historical data confirms what anyone can now verify directly: FICO® Score 10T is the most predictive score.
Read more
FICO® Score High Achievers: Is Age the Only Factor?
<p>FICO’s latest research on <a href="http://www.fico.com/en/blogs/risk-compliance/us-credit-quality-rising-the-beat-goes-on/" target="_blank">national FICO® Score distribution</a> shows that US credit quality continues to trend upwards, with an increasing number of consumers scoring in the highest scores ranges. Given that, we decided it was time to refresh our study on “<a href="http://www.fico.com/en/blogs/risk-compliance/infographic-what-does-a-high-credit-scorer-look-like/" target="_blank">FICO® Score high achievers</a>,” where we examine the credit behavioural profiles of consumers with higher credit scores.</p> <p>As expected, our latest study showed that older people generally have higher scores, as has been the case in our <a href="http://www.fico.com/en/blogs/risk-compliance/age-before-beauty-credit-worthiness-before-youth/" target="_blank">past research</a>. This is largely because they have trade lines that have been open longer, which leads to higher scores (assuming the trade lines are in good standing and all other things equal). The most credit savvy among you will remember that length of credit history accounts for roughly 15% of the overall <a href="http://www.myfico.com/CreditEducation/WhatsInYourScore.aspx" target="_blank">FICO® Score calculation</a>.</p> <p>But for younger consumers, it isn’t too helpful to say, “just wait until you are 50 years old, and that will fix things!” Thus, I decided to dive deeper with our analysis, including looking at the credit behavioural characteristics of younger consumers with high FICO® Scores.</p> <p>In this analysis, I looked at credit characteristics for the two highest score bands, 750-799 and 800-850, which have about 16% and 23% of the population, respectively. I further broke this down by looking at the characteristics of the youngest 15% in each group, which occurs at age 29 for the 750-799 group and 43 for the 800-850. We used FICO<strong>®</strong> Score 9 for our analysis, and examined typical variables of the categories that go into the make-up of the score.</p> <p><a href="http://www.fico.com/en/blogs/wp-content/uploads/2016/10/FICO-Score-High-Achiever-table.png"><img class="alignnone size-full wp-image-29367" src="http://www.fico.com/en/blogs/wp-content/uploads/2016/10/FICO-Score-High-Achiever-table.png" alt="fico-score-high-achiever-table" width="715" height="747" /></a></p> <p>Since there’s a lot to dissect in this chart, I’ll highlight a few findings that struck me: <ul> <li><strong>Credit history.</strong> Higher scores are undoubtedly associated with a longer time on file. What’s striking is the higher average time on file for the 800+ group, both overall and for revolving accounts (the most common trade line). Clearly, it helps to start credit use early in life – but that’s not the sole determining factor for high scoring. The younger cohorts in both the 800+ and 750-799 groups have time on file medians significantly less than their older counterparts.</li> <li><strong>New credit.</strong> High credit scorers do, in fact, pursue new credit. We see little variation in months since last trade line opening and last inquiry among all groups observed.</li> <li><strong>Pay on time.</strong> As you might expect, the further in the past the delinquency, the higher the score – and that’s <u>if</u> a delinquency ever happened. 95% of the 800+ people and 72% of the 750-799 group have never been delinquent, which is a striking contrast to the 57% for the total population. The percentages for the younger groups are even higher, especially so for the 750-799ers. Collection items are also scarce for these high scorers. While 23% of the national population have collection items greater than $99, the figures are only 0.5% for the 800+ group and 3% for the 750-799 group. It is clear that, in conjunction with starting a credit file early, paying on time is a key trait of the FICO® Score high achiever.</li> <li><strong>Balance and utilization.</strong> Finally, we look at how credit is being used, focusing on revolving product use. (Since most people only have one mortgage or one auto loan, variation in instalment product figures is minimal and driven by payment history, which is near perfect for high scorers, as we’ve seen.) FICO® Score high achievers tend to have more open revolving accounts. While the % active trades and utilization are generally lower, by no means do high scorers avoid the use of credit products. What drives the difference here is the amount of <u>available</u> revolving credit utilized. The 800+ group is roughly 1/4 of the national median, both in total and on their highest utilized card; they also have lower balances and more cards<em>. </em>The 750-799 group is more active and higher utilized, but still only at 2/3 of the national figures. The young 750-799 group compensate with lower revolving balances and, as a result, lower utilization, which is in line with what we see for the 800+ group.</li> <li><strong>Benchmarks.</strong> I’d like to point out that while this study provides good benchmarks of the typical credit traits of the FICO® Score high achiever, individual credit profiles will vary widely. And keep in mind that when we sort groups of consumers as a whole by different behaviours, some results may look superficially odd. For example, the 800+ band has a longer median average open account time (128 months) than average revolving months on file (140 months).</li> </ul> So, what do we conclude? A huge takeaway is that high scorers don’t have too much in the way of serious delinquencies and negative public record data.</p> <p>In most respects, the young 800+ people are like their peer group. They really only differ markedly in their shorter credit history and higher non-mortgage balance, both of which are a function of life stage. Our results show that you don’t have to be a credit product hermit; these high scorers have more credit cards. The takeaway is to start credit activity early and maintain well-managed and moderate usage.</p> <p>In many ways, the young 750-799 people are more interesting because their age profile is much younger. Their credit characteristics differ more from their peer group, particularly in terms of length of credit history. They compensate by having almost pristine credit records and lower balances.</p> <p>Ultimately, 39% of US consumers are FICO® Score high achievers, which they accomplish by following common-sense credit practices. It ain’t rocket science!</p>
Read moreTake the next step
Connect with FICO for answers to all your product and solution questions. Interested in becoming a business partner? Contact us to learn more. We look forward to hearing from you.