‘FICO Drift’: What Is It, and What Causes It?
FICO® Scores rank-order the likelihood of borrowers’ credit repayment risk - the relationship between the FICO Score and repayment odds can and does shift

Earlier this year, I attended the SFVegas conference, and I was struck by the number of attendees who approached me and asked about “FICO drift”. By “FICO drift”, these individuals were referring to the fact that the level of repayment risk associated with a given FICO® Score had changed or ‘drifted’ over the last few years.
Each time this topic was brought up, it gave me a chance to reinforce what the FICO® Score is and is not designed to do. What FICO Scores do, and do very well, is rank-order the likelihood of borrowers’ credit repayment risk. In other words, a pool of 760 borrowers will represent higher repayment rates than a pool of 700 borrowers, who will in turn represent higher repayment rates than a pool of 640 borrowers, and so on, at that same point in time. This rank-ordering also holds over time and across different economic cycles.
What the FICO Score is not designed to do is provide a specific, fixed estimate of credit risk; we know from tracking the scores over three-plus decades that the relationship between the FICO Score and consumers’ likelihood of loan repayment can and does shift over time and across economic and financial cycles.
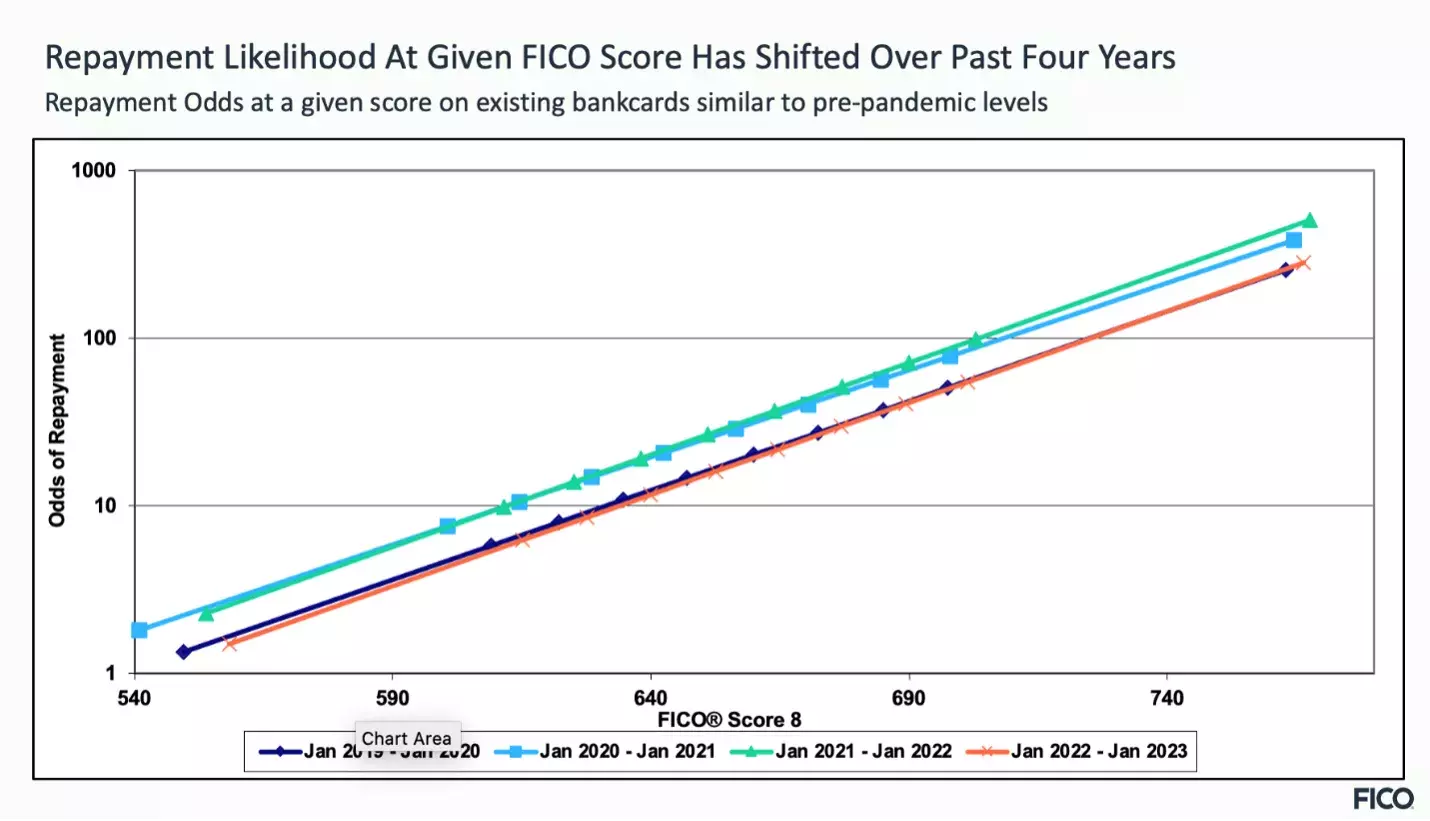
As shown in Figure 1, we have indeed observed a shift in the relationship between FICO® Score 8 and odds of repayment over the past few years. In this figure, odds of repayment are defined as the number of satisfactory payers for every one ‘defaulter’ (where default is defined as 90+ days past due) over a 12-month outcome period.
Figure 1 plots the odds-to-score relationship specifically on existing bankcard accounts, but we have observed similar trends across other products (e.g., auto, mortgage, personal loan) and lifecycles (e.g., originations). Note that this odds-to-score relationship peaked in the first years after the onset of the COVID-19 pandemic, when government stimulus, lender payment accommodation and other tactics aimed at mitigating the financial impacts of the pandemic on borrowers led to historically low default rates. In recent quarters, we’ve seen many of those mitigation tactics phased out, and along with it, a natural reversion towards repayment rates more aligned with pre-pandemic levels.
Another thing to note about Figure 1 is that the slope of the FICO® Score 8 odds-to-score relationship remains steep in the most recent time period. In other words, even as the relationship between odds of repayment and score has shifted, the score has retained its powerful ability to distinguish repayment likelihood between low and high scoring consumers.
A few years prior to the pandemic, the question of shifts in the FICO® Score odds-to-score relationship came up in a slightly different context: whether U.S. consumers’ credit scores were “inflated“ after a decade of economic growth and prosperity. We’ve addressed the topic in a blog post, which for those who have read this far, will sound quite familiar! As noted in that post, a changing relationship between the FICO Score and repayment odds is typically indicative of a shift in one or more of the key drivers of consumer repayment not captured in the traditional credit file (e.g., macroeconomic conditions, lending underwriting practices).
The upshot is this: whether it’s called “FICO drift”, “FICO inflation” (or deflation for that matter!), or something else entirely, a shift in the odds-to-FICO® Score relationship is not cause for questioning the efficacy of the score as a rank-ordering tool. Rather, it is an important opportunity for lenders to assess the calibration of their financial underwriting models, to reflect on where they believe the winds of risk may be blowing and what impacts that might have on loan repayment rates. By adjusting their underwriting strategies accordingly, lenders can be well-positioned to ensure that credit continues to be issued in a robust and responsible manner.
To learn more about FICO’s scoring solutions, click here.

Popular Posts

Has the Reporting of Rental Data to the Credit Reporting Agencies (CRAs) Increased?
FICO Score 10T includes rental data, but consumers can only experience the benefit of this to the extent that their rental data is reported to the CRAs
Read more
FICO Statement on FHFA and FHA Updates to Credit Score Modernization
FICO supports FHFA’s announcement that the long-anticipated historical data for FICO® Score 10T will be released to the mortgage market.
Read more
Average U.S. FICO® Score at 716, Indicating Improvement in Consumer Credit Behaviors Despite Pandemic
The FICO Score is a broad-based, independent standard measure of credit risk
Read moreTake the next step
Connect with FICO for answers to all your product and solution questions. Interested in becoming a business partner? Contact us to learn more. We look forward to hearing from you.