Can Machine Learning Build a Better FICO Score?
FICO conducted a research project to see just how much lift unconstrained, state-of-the-art ML techniques might offer over the FICO Score.

FICO has long been a pioneer in the use of machine learning (ML) and artificial intelligence (AI) to help our clients improve decisions in the financial services industry. Our first patent in this field was over 25 years ago regarding the use of neural nets to detect credit card transaction fraud. Machine learning is used throughout the company, not just in our industry-leading consumer fraud solutions, but in solutions ranging from cybersecurity risk detection to adaptive marketing profiles.
When it comes to credit scoring, we combine the power and speed of insights derived from ML with our 25+ years of domain expertise to ensure that the resulting models are highly predictive as well as explainable to clients, regulators and consumers. This explainability is vital. We recently hit a milestone of 250 million consumer accounts in the US that can access their FICO® Scores for free through our FICO® Score Open Access program. It is important that we be able to explain to these consumers in clear and concise fashion why they scored the way they did.
There are a number of challenges associated with ML techniques — particularly state-of-the-art techniques such as random forests and gradient boosted trees — as far as producing fully transparent, interpretable, and palatable models. While building Explainable AI is something that FICO is very heavily invested in, it is still an active area of research (spanning over the last 25 years) and is relatively nascent in the eyes of regulatory bodies.
Still, we are always testing new approaches and analytic techniques in our ongoing quest to enhance the predictiveness of our FICO® Score models. As part of this, we conducted a research project to see just how much predictive lift unconstrained, state-of-the-art ML techniques might bring to the FICO Score. I will present the results at FICO World 2018 — here’s an overview.
The Machine Learning Test
We currently build our FICO® Score models using the Scorecard Module technology within our FICO® Model Builder software package. The output of a model built via Scorecard Module is an interpretable, engineered scorecard. To calculate FICO Scores, we develop systems of segmented scorecards, each tuned to a different sub-population. And just like our scorecards are engineered to be highly predictive and explainable, so are the associated segmentation schemes.
In our research, we rebuilt our latest FICO® Score — FICO® Score 9 — using two state-of-the-art learning techniques: neural nets and gradient boosted trees. We controlled everything else about this experiment: We used the same dataset of millions of consumer credit files that we used to build FICO Score 9, and the same set of hundreds of variables that we used as candidates for inclusion in the FICO Score 9 model.
That’s an important point. We were seeking a truly apples-to-apples comparison of the different modeling techniques versus confounding this analysis with exploration of relative strengths in feature creation. The goal was to understand what kind of improvement in model accuracy could be obtained by exploring ML model architectures with all else held equal, utilizing unconstrained ML techniques.
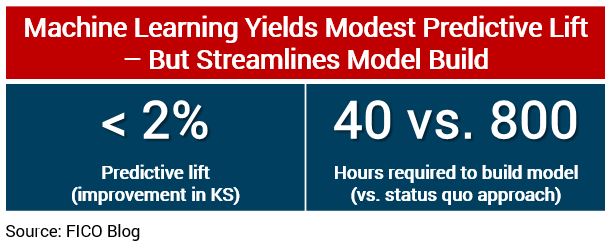
Our findings may surprise you: We identified very modest predictive lift of less than 2% improvement in KS (the Kolmogorov-Smirnov statistic) from using these cutting edge ML techniques. We examined the scores’ effectiveness across different products (auto, mortgage and bankcard), as well as different lifecycle applications (acquisitions and account management). Consistently, we found that the additional lift offered by the ML-driven algorithms was in that modest 1-2% range.
Why Didn’t Machine Learning Give Us More Lift?
So why such little lift? When you’ve mined a relatively stable data source for 25+ years as we have with credit bureau data, and over that time built out very sophisticated systems of scorecards, that approach seems to be able to capture almost all of the signal and complex interactions among variables that even cutting-edge ML techniques can uncover.
While ML may not be the solution to drive an evolutionary improvement in the FICO® Score, we still saw plenty of evidence of the reasons machine learning is going to be a key driver of the future of analytics.
One data point: It took a single analyst a matter of 40 hours to build the ML score that showed slightly improved risk prediction over the FICO® Score 9 models, which took 5 analysts a month to build. We’re talking about an order of magnitude reduction in the number of resource hours required to build out the algorithm. For a score with broad adoption like the FICO® Score, it’s easier to make the case for investing those additional hours to have 5 analysts refine the model. But for R&D efforts aimed at studying new analytic challenges or new data sources where we have less expertise, ML can be a very powerful tool for getting to important insights much faster than conventional methods.
Why doesn’t a 2% improvement — indeed, any improvement — justify replacing the FICO® Score with one built using state-of-the-art machine learning techniques? It might, were it not for the explainability issues noted earlier. With the ML models, we get reduced model transparency, and an inability to ensure that the resulting patterns encoded in the model are fully palatable and intuitive. It would be hard to explain these patterns to consumers or regulators, not to mention lenders.
Research Continues
FICO is heavily invested in ML and its application to fraud detection, cybersecurity, marketing and other business challenges. Within the realm of credit risk, we use ML as a powerful tool for getting to fast insights about the potential of credit risk scores in new markets, or the potential of new data sources we haven’t previously worked with, as well as for horse-racing (aka benchmarking) our Scorecard-based models against the latest and greatest machine learning breeds.
We’re going to continue to research ways to bring the advantages machine learning offers in terms of automation and model effectiveness together with our domain expertise in building palatable and explainable models. Keep an eye on the explainable AI topic, it’s a major focus of ML research at FICO right now.
For more insights on this ML “horse race”, including our findings as relates to comparative predictive strength and model explainability/palatability, please join me at FICO World the week of April 16th.

Popular Posts

Average U.S. FICO® Score at 716, Indicating Improvement in Consumer Credit Behaviors Despite Pandemic
The FICO Score is a broad-based, independent standard measure of credit risk
Read more
The GSE Data Is Public. Here's What It Shows About Credit Score Modernization.
Independent Milliman analysis of GSE historical data confirms what anyone can now verify directly: FICO® Score 10T is the most predictive score.
Read more
FICO® Score High Achievers: Is Age the Only Factor?
<p>FICO’s latest research on <a href="http://www.fico.com/en/blogs/risk-compliance/us-credit-quality-rising-the-beat-goes-on/" target="_blank">national FICO® Score distribution</a> shows that US credit quality continues to trend upwards, with an increasing number of consumers scoring in the highest scores ranges. Given that, we decided it was time to refresh our study on “<a href="http://www.fico.com/en/blogs/risk-compliance/infographic-what-does-a-high-credit-scorer-look-like/" target="_blank">FICO® Score high achievers</a>,” where we examine the credit behavioural profiles of consumers with higher credit scores.</p> <p>As expected, our latest study showed that older people generally have higher scores, as has been the case in our <a href="http://www.fico.com/en/blogs/risk-compliance/age-before-beauty-credit-worthiness-before-youth/" target="_blank">past research</a>. This is largely because they have trade lines that have been open longer, which leads to higher scores (assuming the trade lines are in good standing and all other things equal). The most credit savvy among you will remember that length of credit history accounts for roughly 15% of the overall <a href="http://www.myfico.com/CreditEducation/WhatsInYourScore.aspx" target="_blank">FICO® Score calculation</a>.</p> <p>But for younger consumers, it isn’t too helpful to say, “just wait until you are 50 years old, and that will fix things!” Thus, I decided to dive deeper with our analysis, including looking at the credit behavioural characteristics of younger consumers with high FICO® Scores.</p> <p>In this analysis, I looked at credit characteristics for the two highest score bands, 750-799 and 800-850, which have about 16% and 23% of the population, respectively. I further broke this down by looking at the characteristics of the youngest 15% in each group, which occurs at age 29 for the 750-799 group and 43 for the 800-850. We used FICO<strong>®</strong> Score 9 for our analysis, and examined typical variables of the categories that go into the make-up of the score.</p> <p><a href="http://www.fico.com/en/blogs/wp-content/uploads/2016/10/FICO-Score-High-Achiever-table.png"><img class="alignnone size-full wp-image-29367" src="http://www.fico.com/en/blogs/wp-content/uploads/2016/10/FICO-Score-High-Achiever-table.png" alt="fico-score-high-achiever-table" width="715" height="747" /></a></p> <p>Since there’s a lot to dissect in this chart, I’ll highlight a few findings that struck me: <ul> <li><strong>Credit history.</strong> Higher scores are undoubtedly associated with a longer time on file. What’s striking is the higher average time on file for the 800+ group, both overall and for revolving accounts (the most common trade line). Clearly, it helps to start credit use early in life – but that’s not the sole determining factor for high scoring. The younger cohorts in both the 800+ and 750-799 groups have time on file medians significantly less than their older counterparts.</li> <li><strong>New credit.</strong> High credit scorers do, in fact, pursue new credit. We see little variation in months since last trade line opening and last inquiry among all groups observed.</li> <li><strong>Pay on time.</strong> As you might expect, the further in the past the delinquency, the higher the score – and that’s <u>if</u> a delinquency ever happened. 95% of the 800+ people and 72% of the 750-799 group have never been delinquent, which is a striking contrast to the 57% for the total population. The percentages for the younger groups are even higher, especially so for the 750-799ers. Collection items are also scarce for these high scorers. While 23% of the national population have collection items greater than $99, the figures are only 0.5% for the 800+ group and 3% for the 750-799 group. It is clear that, in conjunction with starting a credit file early, paying on time is a key trait of the FICO® Score high achiever.</li> <li><strong>Balance and utilization.</strong> Finally, we look at how credit is being used, focusing on revolving product use. (Since most people only have one mortgage or one auto loan, variation in instalment product figures is minimal and driven by payment history, which is near perfect for high scorers, as we’ve seen.) FICO® Score high achievers tend to have more open revolving accounts. While the % active trades and utilization are generally lower, by no means do high scorers avoid the use of credit products. What drives the difference here is the amount of <u>available</u> revolving credit utilized. The 800+ group is roughly 1/4 of the national median, both in total and on their highest utilized card; they also have lower balances and more cards<em>. </em>The 750-799 group is more active and higher utilized, but still only at 2/3 of the national figures. The young 750-799 group compensate with lower revolving balances and, as a result, lower utilization, which is in line with what we see for the 800+ group.</li> <li><strong>Benchmarks.</strong> I’d like to point out that while this study provides good benchmarks of the typical credit traits of the FICO® Score high achiever, individual credit profiles will vary widely. And keep in mind that when we sort groups of consumers as a whole by different behaviours, some results may look superficially odd. For example, the 800+ band has a longer median average open account time (128 months) than average revolving months on file (140 months).</li> </ul> So, what do we conclude? A huge takeaway is that high scorers don’t have too much in the way of serious delinquencies and negative public record data.</p> <p>In most respects, the young 800+ people are like their peer group. They really only differ markedly in their shorter credit history and higher non-mortgage balance, both of which are a function of life stage. Our results show that you don’t have to be a credit product hermit; these high scorers have more credit cards. The takeaway is to start credit activity early and maintain well-managed and moderate usage.</p> <p>In many ways, the young 750-799 people are more interesting because their age profile is much younger. Their credit characteristics differ more from their peer group, particularly in terms of length of credit history. They compensate by having almost pristine credit records and lower balances.</p> <p>Ultimately, 39% of US consumers are FICO® Score high achievers, which they accomplish by following common-sense credit practices. It ain’t rocket science!</p>
Read moreTake the next step
Connect with FICO for answers to all your product and solution questions. Interested in becoming a business partner? Contact us to learn more. We look forward to hearing from you.